#!/usr/bin/env python3
import matplotlib.pyplot as plt
import numpy as np

kx = 15
ky = 10

xs = np.linspace(0, 1, 100)
ys = np.linspace(0, 1, 100)
xs, ys = np.meshgrid(xs, ys, indexing='ij')

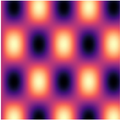
zs = np.sin(kx * xs) * np.cos(ky * ys)

fig, axis = plt.subplots(figsize=(10, 10))
axis.pcolormesh(xs, ys, zs, cmap='magma')
plt.axis('equal')
plt.axis('off')
axis.xaxis.set_major_locator(plt.NullLocator())
axis.yaxis.set_major_locator(plt.NullLocator())
plt.savefig('map.png', bbox_inches='tight', pad_inches=0)
Les dernières lignes sont juste du boilerplate pour se débarrasser des bordures qui seraient occupées par les axes (matplotlib étant fait pour faire des graphiques scientifiques à la base).
Ça donne ça.
Bien sûr changer la fonction donnera des résultats plus intéressants.
+1
-0


