
Bonjour,
J'utilise matplotlib et Python3 pour générer des graphes mais les images enregistrées ne sont pas celles escomptées :
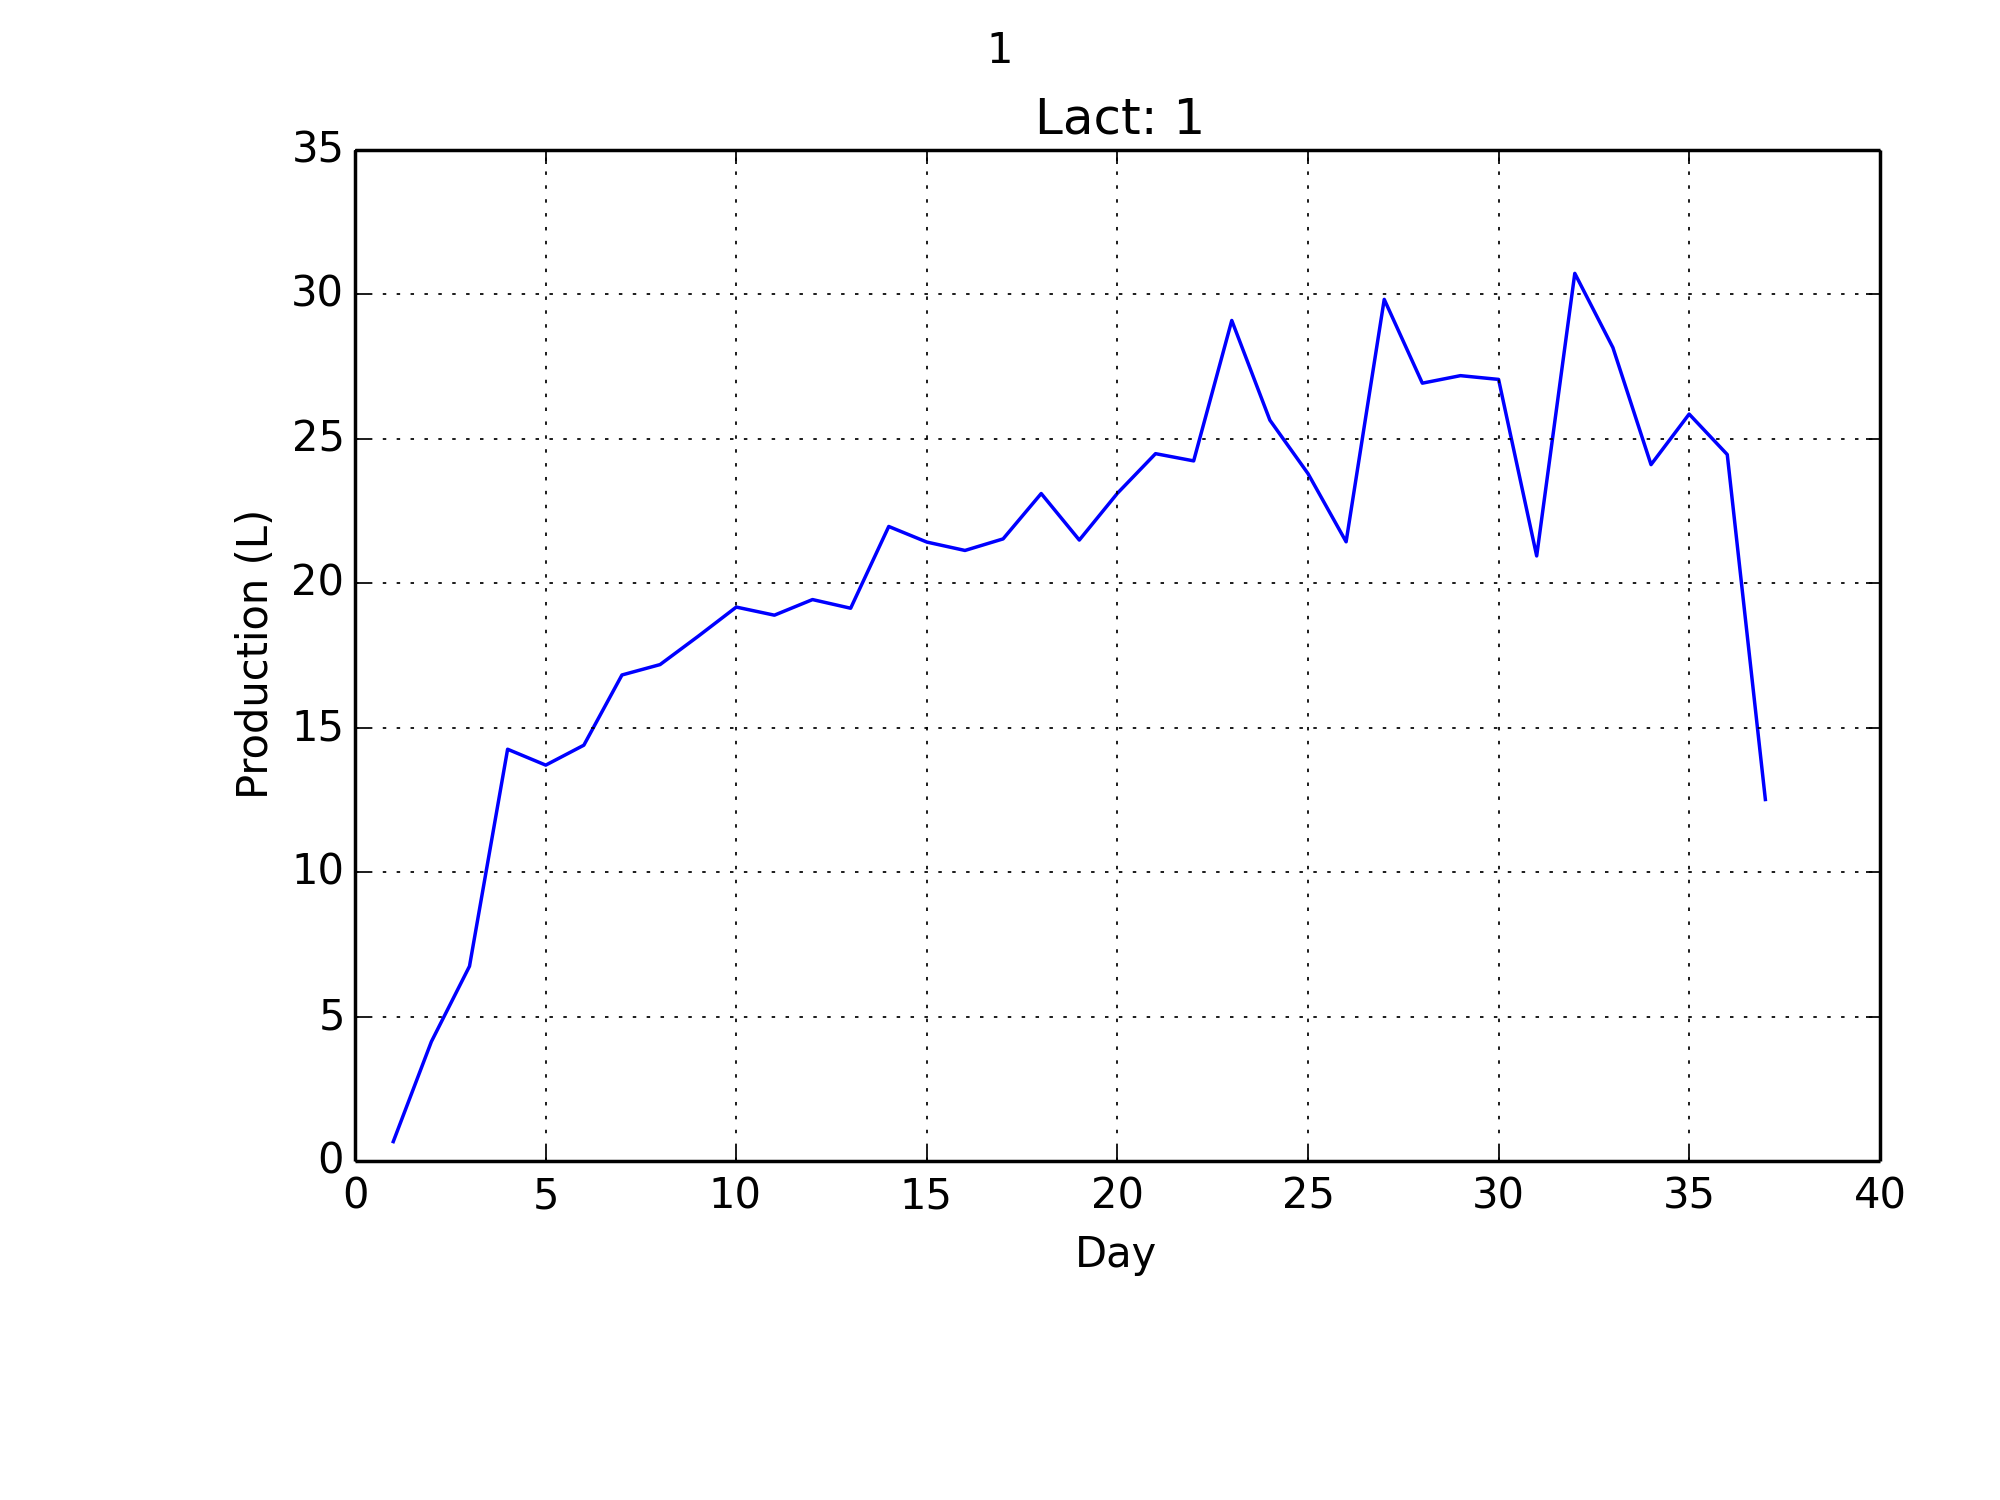
http://zestedesavoir.com/media/galleries/1252/b624d81c-8e4b-4749-96f8-57827f5dc5a6.png
http://zestedesavoir.com/media/galleries/1252/b3e80c6e-7d06-4cef-8aa0-e374bc4cee68.png
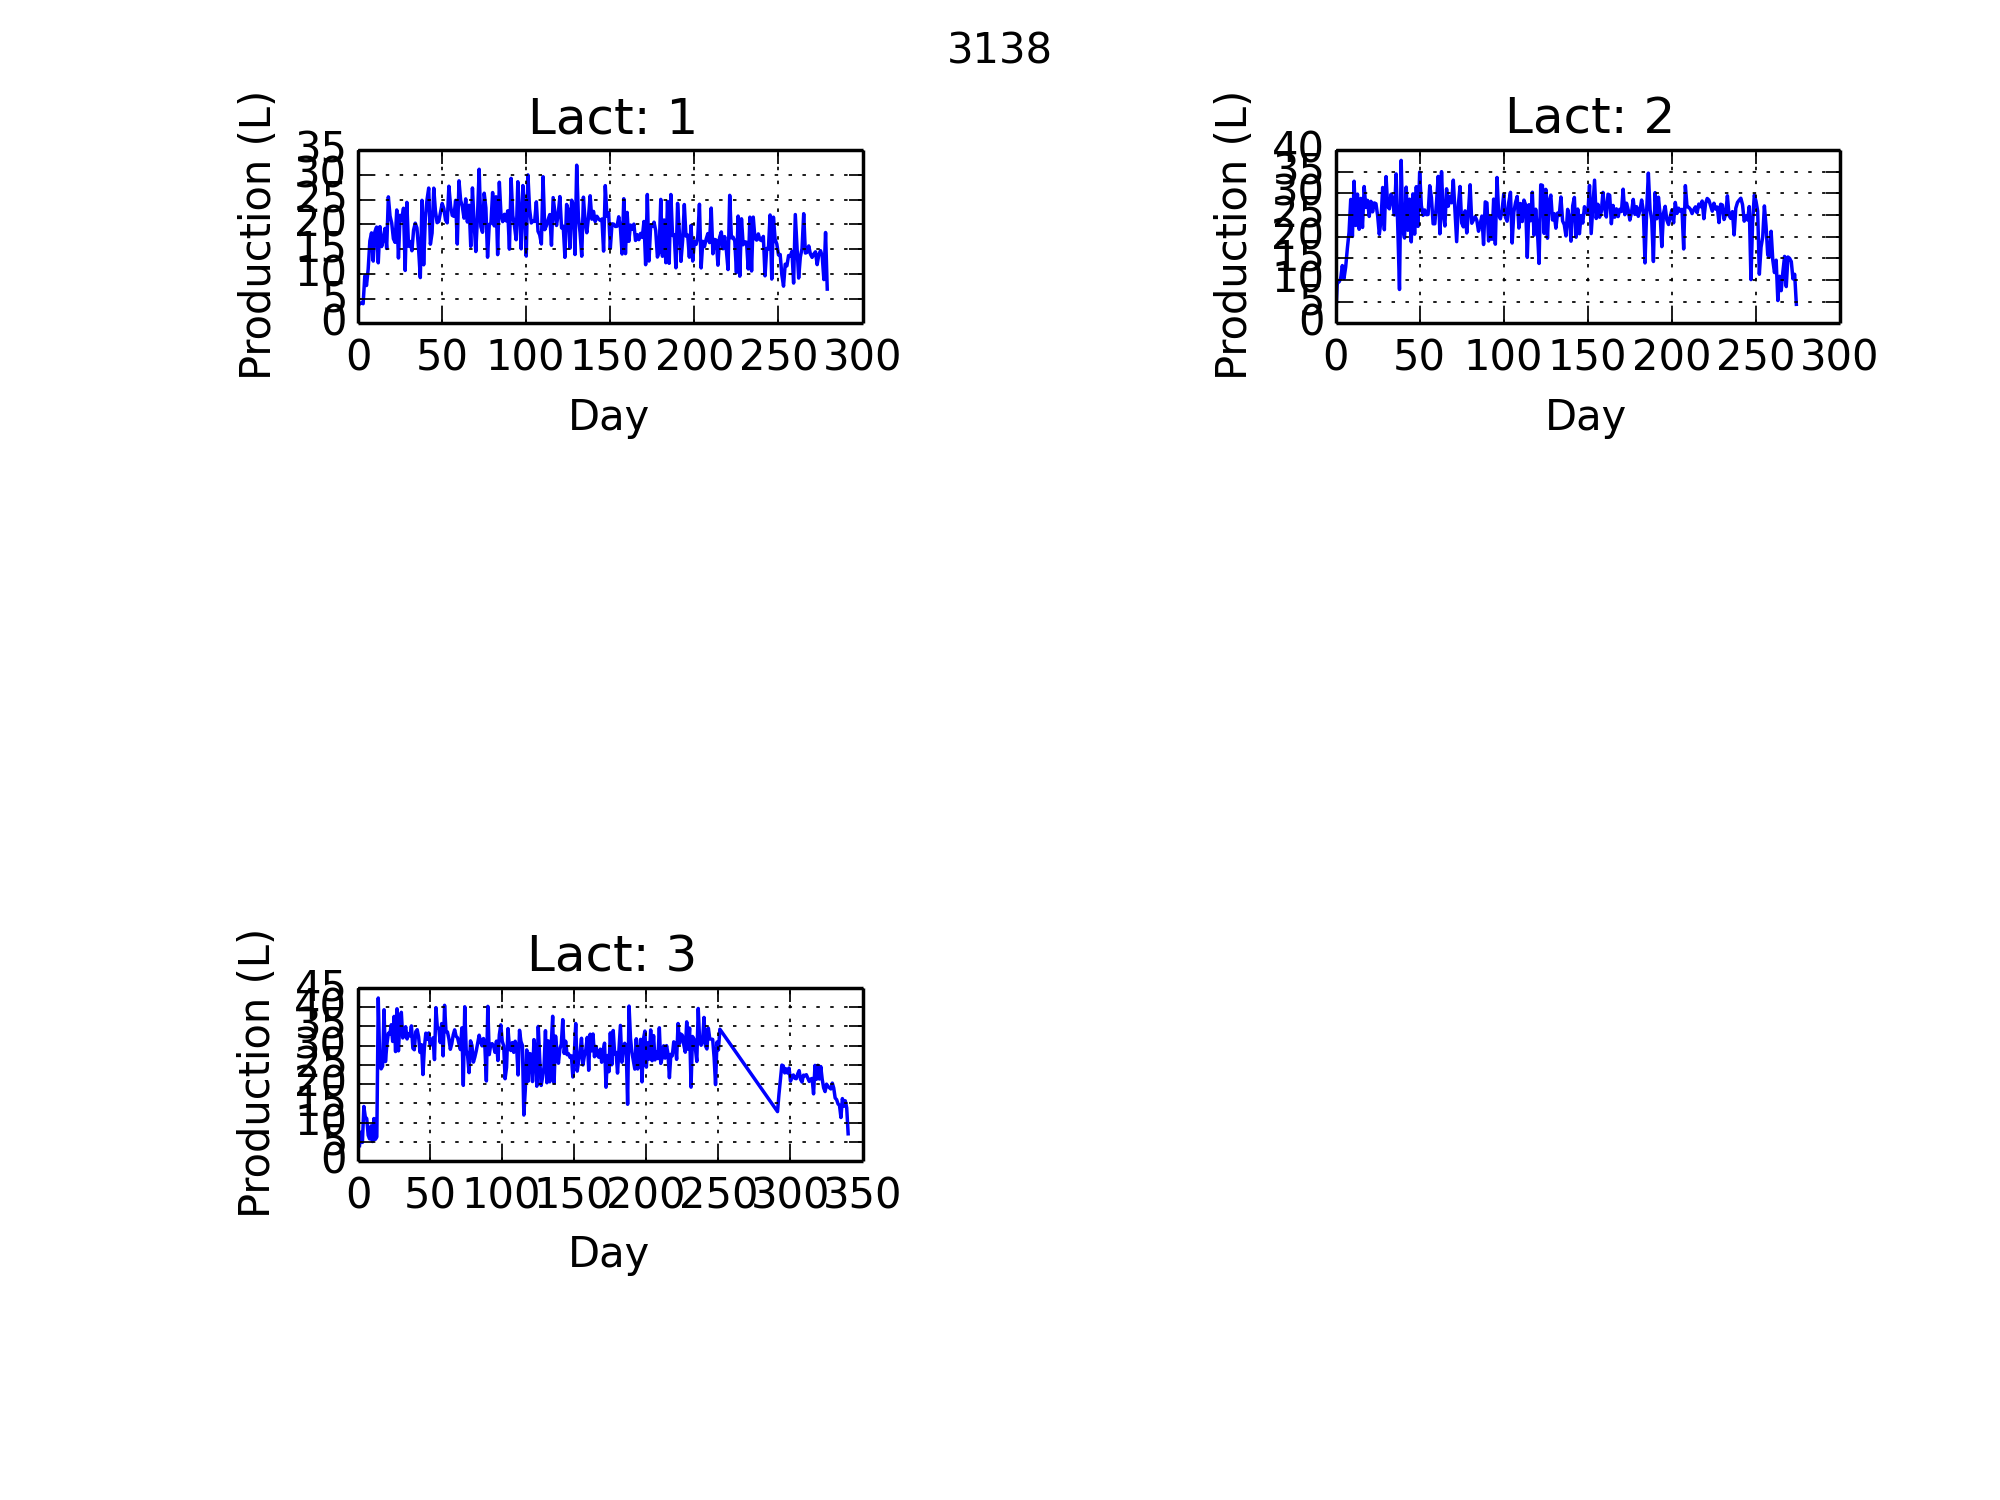
/!\ http://zestedesavoir.com/media/galleries/1252/62a28dda-8839-4c2a-a632-f48c40c10a49.png
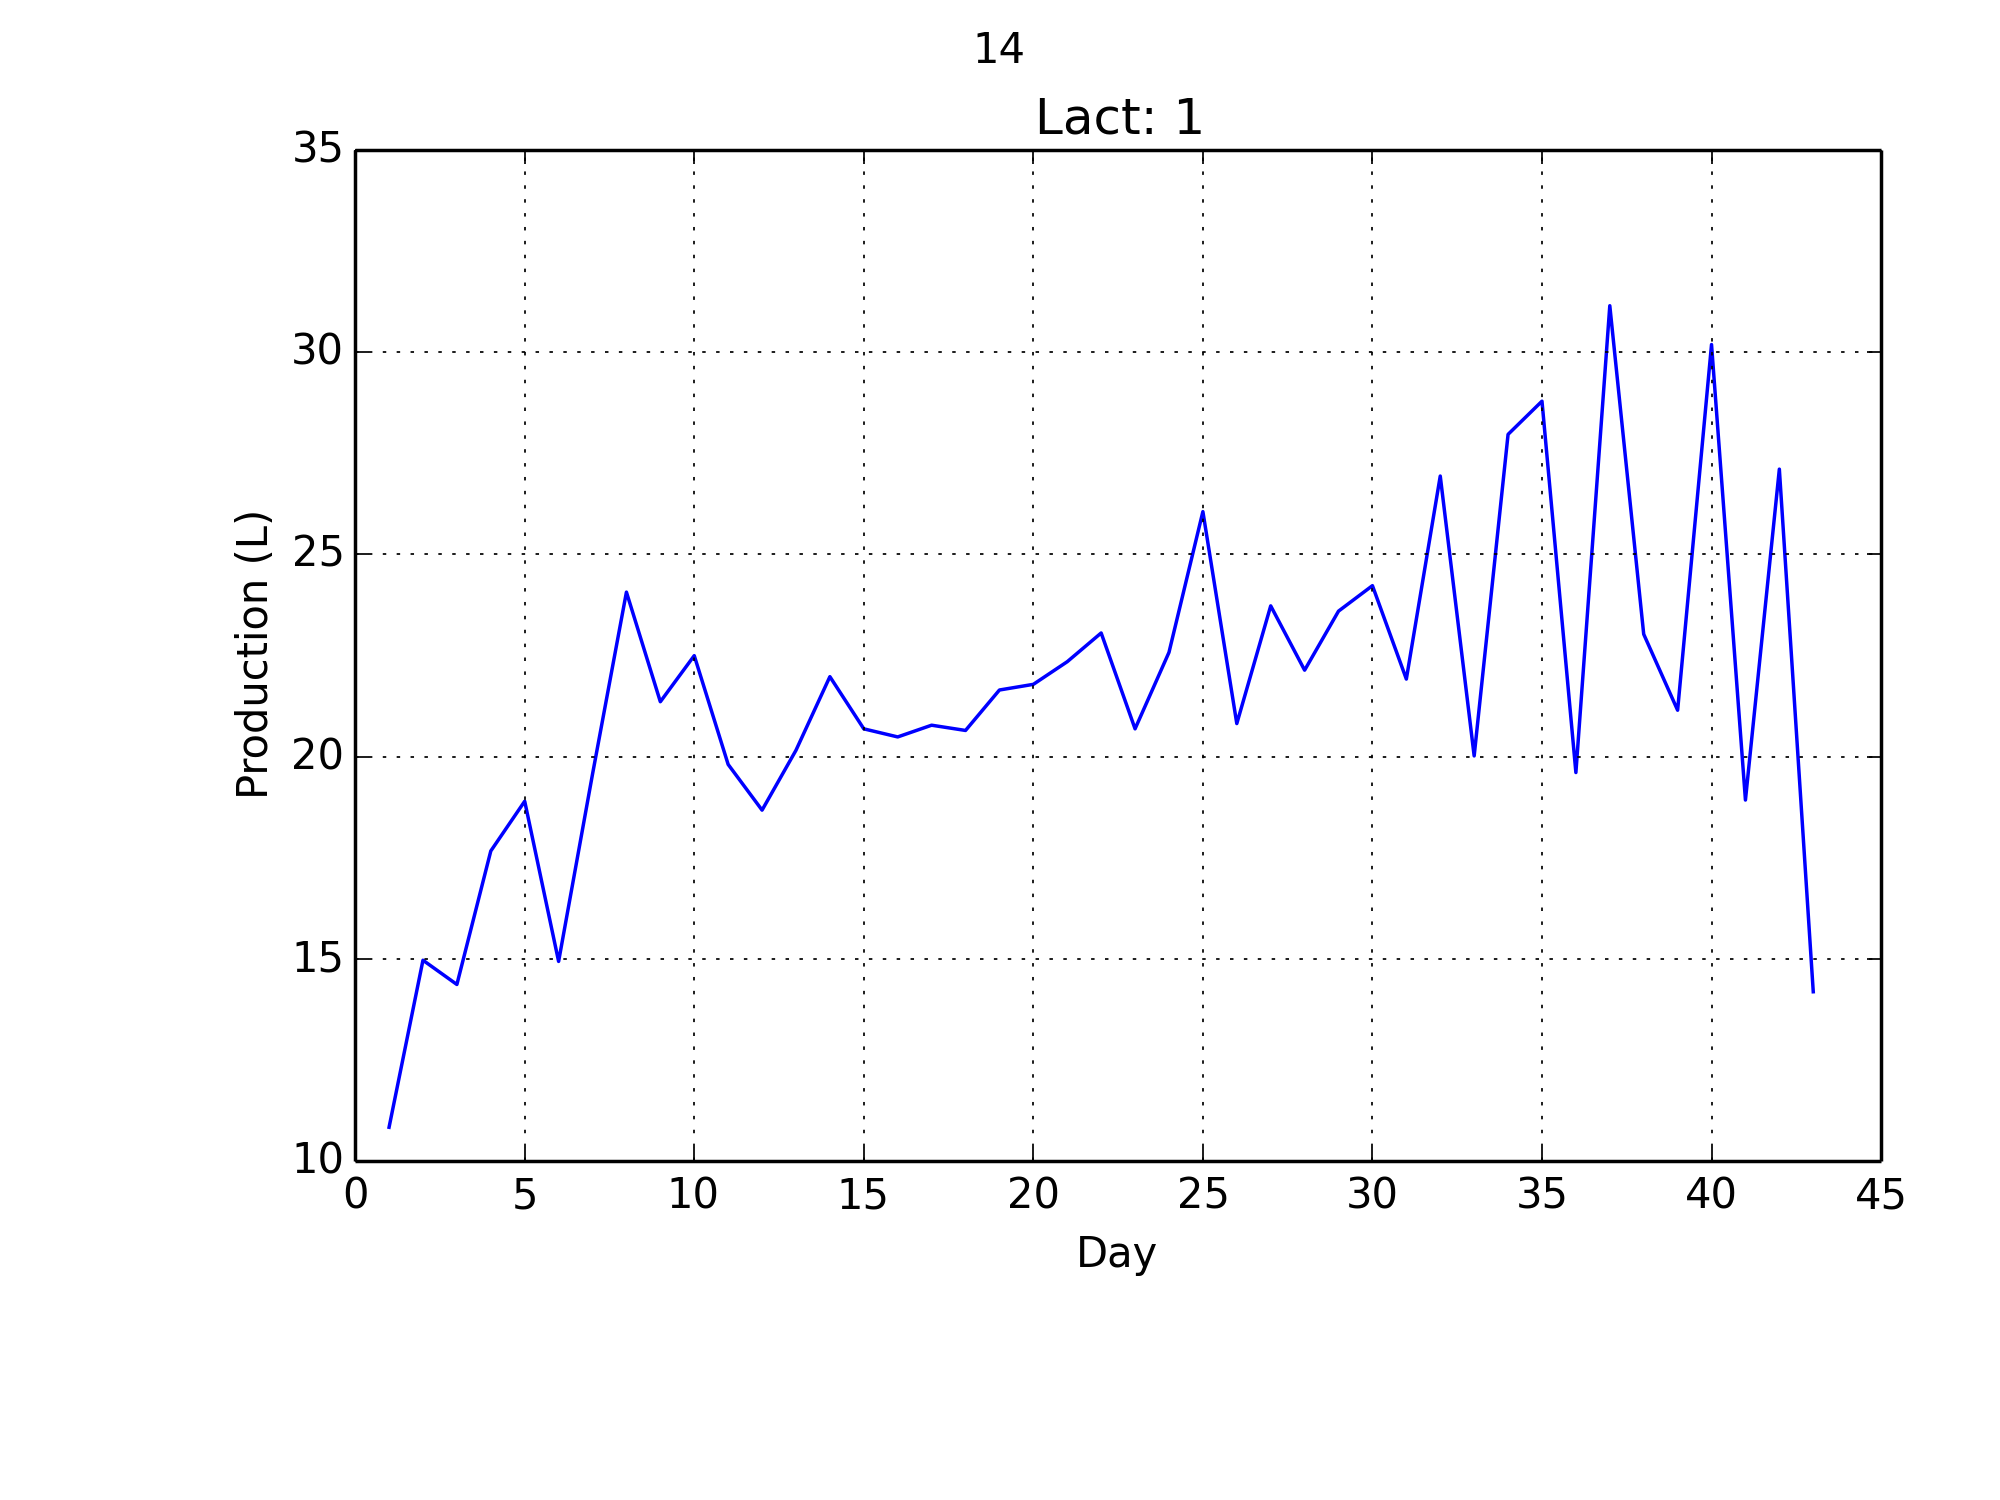
http://zestedesavoir.com/media/galleries/1252/61f8743e-08fa-4a65-b3b5-7159bb761e89.png
Le code est le suivant :
1 2 3 4 5 6 7 8 9 10 11 12 13 14 15 16 17 18 19 20 21 22 23 24 25 26 27 28 29 30 31 32 33 34 35 36 37 38 39 40 41 42 43 44 45 46 47 48 49 50 51 52 53 54 55 56 57 58 59 60 61 62 63 64 65 66 67 68 69 70 71 72 73 74 75 76 77 78 79 80 81 82 83 84 85 86 87 88 89 90 | from math import sqrt, ceil import matplotlib.pyplot as plt class Drawer: def __init__(self, title=""): self.title = title self.clear() self.X_INDEX = 0 self.Y_INDEX = 1 self.TITLE_INDEX = 2 self.XLABEL_INDEX = 3 self.YLABEL_INDEX = 4 def add(self, x, y, title="", xlabel="x", ylabel="y"): self.data.append((x, y, title, xlabel, ylabel)) def clear(self): plt.clf() self.data = [] def draw(self): l = len(self.data) cols = int(ceil(sqrt(l))) lines = int(ceil(l/cols)) fig = plt.figure(num=1, figsize=(4.5, 3)) fig.suptitle(self.title) for k in range(l): x = self.data[k][self.X_INDEX] y = self.data[k][self.Y_INDEX] title = self.data[k][self.TITLE_INDEX] xlabel = self.data[k][self.XLABEL_INDEX] ylabel = self.data[k][self.YLABEL_INDEX] plt.subplot(lines, cols, k+1) plt.plot(x, y) plt.xlabel(xlabel) plt.ylabel(ylabel) plt.grid(True) plt.title(title) plt.tight_layout() # To space subplots plt.subplots_adjust(top=0.9) # Not to overwrite title def save(self, dest, clear=True): plt.clf() self.draw() plt.savefig(dest, dpi=250) if clear: self.clear() def show(self, clear=True): plt.clf() self.draw() plt.show() if clear: self.clear() if __name__ == "__main__": drawer = Drawer("TITLE") n = 6 for i in range(n): drawer.add(list(range(i+2)), list(range(i+2)), str(i), "x" + str(i), "y" + str(i)) drawer.show() import sqlite3 from selector import Selector from config import DATABASE_PATH from workers import Productions selector = Selector(sqlite3.connect(DATABASE_PATH)) for cow in [3129, 14, 3138, 1]: drawer = Drawer(cow) worker = Productions(selector, selector.get_lact_days) data = worker.work(cow) for line in data: x = line["x"] y = line["y"] title = "Lact: {}".format(line["lact"]) drawer.add(x, y, title, xlabel="Day", ylabel="Production (L)") drawer.save("./{}.by-day.png".format(cow)) |
Etonnemment, si je remplace save par show, tout fonctionne comme prévu. De plus, les images avec un seul graphe sont correctes, ainsi que la première seulement avec plusieurs graphes.
Edit : le problème semble provenir de :
1 2 | plt.tight_layout() # To space subplots plt.subplots_adjust(top=0.9) # Not to overwrite title |
Effectivement, quand j'enlève plt.tight_layout(), ça fonctionne, même si du coup le rendu plus compact.
Second edit : du coup, il faut utiliser plt.close() et non plt.clf(), qui ne fait que nettoyer la fenêtre, mais ne la supprime pas.
Merci. =)