Matplotlib graphique avec en x des chaines de caractères

a marqué ce sujet comme résolu.

Bonjour à tous et à toutes,

j’ai vu de nombreux tutos sur matplotlib comme celui-ci http://apprendre-python.com/page-creer-graphiques-scientifiques-python-apprendre cependant je n’arrive pas à savoir comment intégrer des chaines de caractère par exemple sur l’axe X.

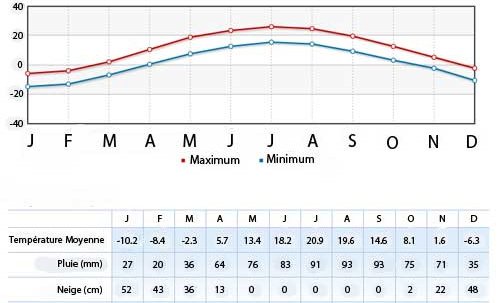
En effet, je veux réaliser un graphique qui affiche une certaine valeur en y (un entier) en fonction d’une date qui serait elle du coup une chaîne de caractère.

Par exemple : Image utilisateur

Avez-vous une idée pour me venir en aide ou un tuto à me conseiller ?

Merci d’avance, si je ne suis pas clair n’hésitez pas à me le dire ^^

xticks. ;)

En pratique :

1
2
3
4
5
6
7
>>> import matplotlib.pyplot as plt
>>> y = [1, 2, 3, 5, 1, 2, 4, 6, 3]
>>> plt.xticks( range(12), "jfmamjjasond")
... ([<matplotlib.axis.XTick object at 0x7f43a7850f98>, <matplotlib.axis.XTick object at 0x7f43a7876860>, <matplotlib.axis.XTick object at 0x7f43a78a16d8>, <matplotlib.axis.XTick object at 0x7f43a758c7f0>, <matplotlib.axis.XTick object at 0x7f43a758f240>, <matplotlib.axis.XTick object at 0x7f43a758fc50>, <matplotlib.axis.XTick object at 0x7f43a75936a0>, <matplotlib.axis.XTick object at 0x7f43a75980f0>, <matplotlib.axis.XTick object at 0x7f43a7598b00>, <matplotlib.axis.XTick object at 0x7f43a759b550>, <matplotlib.axis.XTick object at 0x7f43a759bf60>, <matplotlib.axis.XTick object at 0x7f43a75a09b0>], <a list of 12 Text xticklabel objects>)
>>> plt.plot(y)
[<matplotlib.lines.Line2D object at 0x7f43a7864358>]
>>> plt.show()

xticks prend un emplacement où il va mettre des chaines, et un itérable contenant des chaines. Donc si tu veux des mots plutôt que des lettre, il faut donner range(12), ["Janvier, "Février".... Tu as des infos et des exemples (dont un avec le calendrier) dans la doc, help(plt.xticks).

Édit : erreur dans le code (mauvais import).

+2 -0

Merci pour ta réponse et désolé de te répondre si tard mais je rencontre un problème quand j’exécute le code que tu as écrit :

1
2
3
4
5
6
Traceback (most recent call last):
  File "matplotlib.py", line 1, in <module>
    import matplotlib as plt
  File "D:\python\lbc\matplotlib.py", line 3, in <module>
    plt.xticks(range(12), "jfmamjjasond")
AttributeError: module 'matplotlib' has no attribute 'xticks'

Je ne sais pas comment régler ce problème.

+0 -0

Le code suivant ne marche pas ?

1
2
3
4
5
import matplotlib.pyplot as plt
y = [1, 2, 3, 5, 1, 2, 4, 6, 3]
plt.xticks( range(12), "jfmamjjasond")
plt.plot(y)
plt.show()

(Il ne faut pas rajouter l’import entre mon message originel et ma correction, mais le remplacer.)

Si ça ne marche pas, je ne sait pas, mais ça devrait marcher.

+1 -0

Merci de continuer à m’aider, le code dans mon fichier est exactement le même que celui que tu viens de poster mais j’ai toujours l’erreur.

1
2
3
4
5
6
Traceback (most recent call last):
  File "matplotlib.py", line 1, in <module>
    import matplotlib as plt
  File "D:\python\lbc\matplotlib.py", line 3, in <module>
    plt.xticks(range(12), "jfmamjjasond")
AttributeError: module 'matplotlib' has no attribute 'xticks'
+0 -0
Connectez-vous pour pouvoir poster un message.
Connexion

Pas encore membre ?

Créez un compte en une minute pour profiter pleinement de toutes les fonctionnalités de Zeste de Savoir. Ici, tout est gratuit et sans publicité.
Créer un compte